DriftDash - Checking on your validation
Deep Learning based applications are becoming increasingly common in many industries. Feature-based search cat replace more traditional search engines. Deep neural networks excel at matching items with similar ones reliabily and incredibly fast.
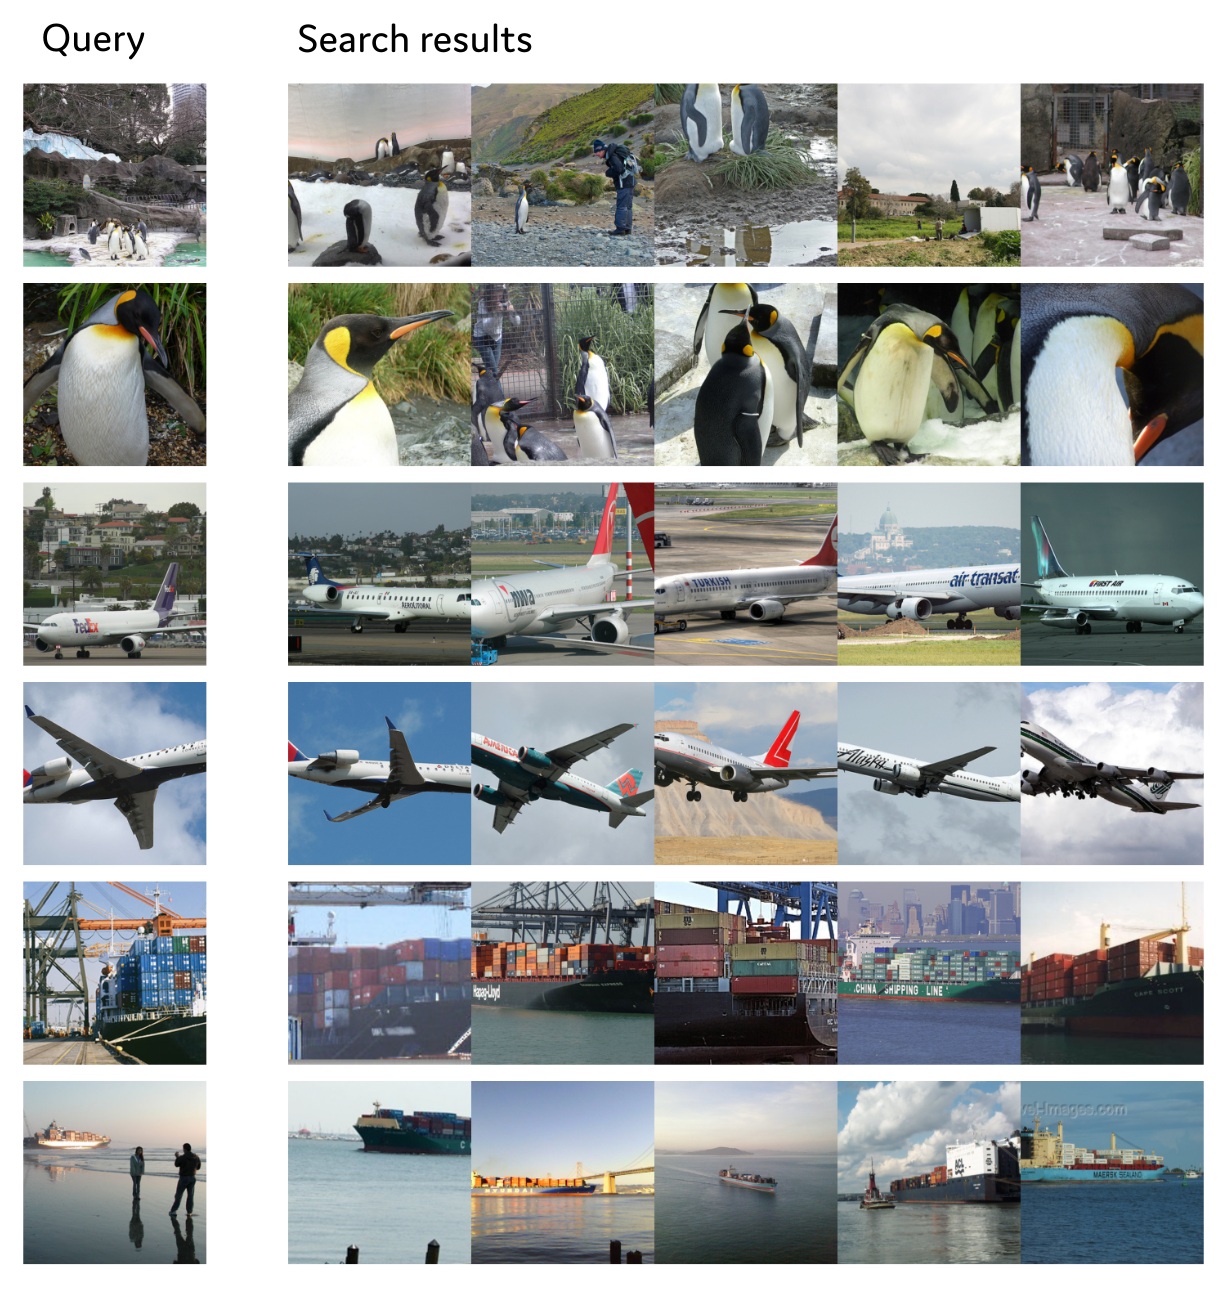
 Visual search enables many systems from internal search engines to recommenders.
But how do we know our image retrieval still works within specification?
In other words: can we trust our model?
Here is a little flowchart how we might check:
There also is more complexity in can your model say "I don't know"? than many people believe. We will see typical problems in the assumptions often made in that context in a separate article discussing advanced drift detection features.
Why we need to know whether our model still works?
In image retrieval
- We want to make sure our recommendation make sense. In particular, showing too many unrelated items annoys users.
- In many situations we may assume the user to be cooperative. So we do worry about detoriation of model performance but not so much about adversarial use. By default, we do not expect people to try to trick our AI into anything.
- The query images are often not from a controlled environment, so we can have many changes system needs to cope with, from changes in vision conditions to changes in materials or products searched. Also, there can be trends or clusters in what people search for.
- Deterioration in the matching can be silient. Given the commercial impact of our systems, we might lose significant amounts of money before noticing.
What can we do to avoid these problems?
In lieu of a theoretical "software verification"-like methodology, we run our model on a validation set. In fancy speak, we use empirical measures of performance to assess the quality of our models. So if our validation set covers what we expect to see in production, we may expect the performance of the model to be similar. Did you see how big that if is? This is the blind spot if we do not actively check for it. We need to verify that the assurances of the validation still apply.
How do we check whether the validation assurances still apply?
If we take the validation dataset as a form of specifying the data seen in the production environment, we want to know if our model is operating within spec.
DriftDash does this by statistical testing the very thing in the big if above: Does the data seen in production resemble the validation data?
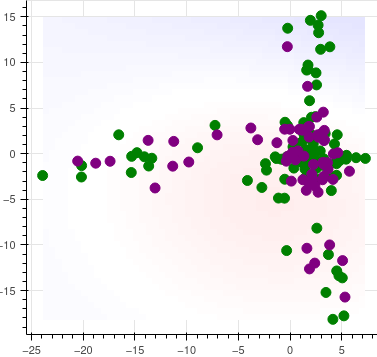
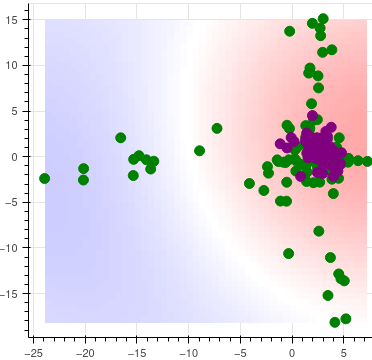
The basis for the statistical test is some representation of the inputs in some d-dimensional space. For the illustration, we take 2 dimensions and plot reference (green) and production (purple) inputs. To the left, we see the latent space representation of a batch of benign images (purple) relative to the validation or reference sample (green). To the right, latents for the images have concentrated around a spot near zero in latent space.


Visually, it seems easy to tell that while the benign inputs to the left also have representations that genuinely match the reference, the drifted distribution (which comes from blurred inputs, e.g. a camera having gone out of focus) has concentrated around zero. Typically this comes with a significant drop in accuracy.
By using a distance measure between the respective distributions of the dots, we can easily formulate our hypothesis and conduct the test. This is precisely what our open source library TorchDrift does. We will leave the maths for another day and discuss a bit how a deployment of a drift detector should look like from a user's perspective.
How can we deploy drift detection with ease?
The first question we might want to consider is when to check for drift. This sounds strange, but there are two main options: We can do the synchronously - before returning the result of, say, our classification - or we can do it asynchronously: we keep the process of querying the model and returning answers the same, but establish a channel to the drift detector. The drift detector then sounds an alarm as it sees fit.
Now, if we look at the problem description in the bullet points above, it would seem that often enough, the asynchronous mode is sufficient. This has the advantage that we do not need to revise the integration of the model into the surroundings to handle an additional failure case and we do not need to wait for the results of the drift detection.
With DriftDash, you only need to use the client API to get the data to the backend, and the the rest will be taken care of asynchronously.
Keeping the overview
The first thing here is that likely, we do not want to monitor just a single model but have a largeish array of them. To my mind, this means we want an overview, with a green, yellow or red traffic light for every model.
So here is how it could look like:
Of course, we might wish our overview to be more boring green than this, but you get the idea. If you wonder about the z-score: we thought long and hard about how to represent the drift indicators in a useful way. In a future article, we will go into the details of how arrived at the z-score as a measure.

Time dimension
As the name drift implies, we are dealing with a phenomenon that decidedly has a temporal aspect. Given that our main tool - the distance - is for a given point in time, it is natural to consider the time series of measurements. This is even more so as we may expect periodic outliers in the measurement due to the distribution of our test statistic. So DriftDash gives you a timeline view. You can also integrate timeline views into your other monitoring using, say, Grafana.

Which inputs caused the problem?
Selecting a given timeline item gives you a scatterplot like the ones shown above. Each dot represents one input processed by the model. If we can visualize the data, for example in an image processing context, we may consider individual examples.
If you look closely at the scatterplots, you can see the background color. Indeed, this is a color plot of the whitness function, which can be used to attribute the distance to the inputs. A darker color indicates a larger contribution to the distance.
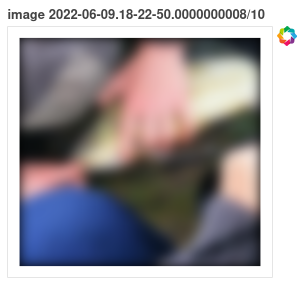
So if we click on one of the dots, we may expect to see a sample, similar to this:

Something has happened to our camera that we got blurred images.
Well good that we detected that and can now do something about it!
Integrate into your existing monitoring
We can sound the alarm for you via mail or webhooks, but of course, we also provide export to existing monitoring systems. We strongly believe that our software should integrate into your landscape and systems as well as it can.

Where do I sign up?
Thank you for reading this far!
We hope you are asking yourself now where you can sign up to testdrive the DriftDash. In indeed you can, just not public quite yet.
At this stage, we have a solution that works well but we foresee that we will work together to optimally integrate with your environment. We are looking for early adopters who are willing to invest a little extra time in return for getting a product that puts their needs first.
Just drop a mail to inquiry@driftdash.de.
We would love to hear about your use case and how we may help you!
We could also use some input on our roadmap - we have lots of ideas and could some input which features are most important to you.
Copyright 2022 by MathInf GmbH. Imprint and privacy information.